OCZ Arc 100 240GB Review

August 13, 2014 | 15:17

Tags: #barefoot-3 #budget-ssd #ssd

Companies: #indilinx #ocz #ocz-storage-solutions #toshiba
Iometer

Website: Iometer

Mixed workloads

To test how SSDs handle intensive and mixed workloads, we use Iometer to simulate the workloads of four real-world heavy use scenarios: database, file server, workstation and web server. The workloads are similar in that they all use fully random data at a total queue depth of 64, but differ by the sizes of the files used and the percentage split of read/write operations.

Each workload is ran and recorded for five minutes, one after the other, with thirty seconds of data before this going unrecorded so as to discard any initial speed bursts. Five minutes may not seem like much, but as you'll see it's easily enough to separate strong controllers from weaker ones with workloads this demanding. The results here are applicable only to the most demanding users - the average home user or gamer need not concern themselves.

Iometer

Database workload (67 percent reads)

  • Samsung SSD 850 Pro 256GB
  • OCZ Vector 150 240GB
  • Toshiba HG6 SSD 512GB
  • OCZ Arc 100 240GB
  • Crucial MX100 512GB
  • Crucial M550 512GB
  • Intel SSD 730 240GB
  • Samsung SSD 840 Pro 256GB
  • SanDisk Extreme PRO 480GB
  • Samsung SSD 840 Evo 500GB
  • SanDisk Extreme II 480GB
  • Samsung SSD 840 Evo 250GB
  • SanDisk Ultra Plus 256GB
    • 57579
    • 56019
    • 52684
    • 52419
    • 46993
    • 46655
    • 41955
    • 38128
    • 34613
    • 28841
    • 28312
    • 21004
    • 18170
0
10000
20000
30000
40000
50000
60000
Average IOPS, Higher Is Better
  • Average IOPS

Iometer

File Server workload (80 percent reads)

  • OCZ Vector 150 240GB
  • Toshiba HG6 SSD 512GB
  • SanDisk Extreme PRO 480GB
  • OCZ Arc 100 240GB
  • Crucial M550 512GB
  • Crucial MX100 512GB
  • Samsung SSD 850 Pro 256GB
  • SanDisk Extreme II 480GB
  • Samsung SSD 840 Pro 256GB
  • Intel SSD 730 240GB
  • Samsung SSD 840 Evo 500GB
  • Samsung SSD 840 Evo 250GB
  • SanDisk Ultra Plus 256GB
    • 40829
    • 38845
    • 36709
    • 35434
    • 34083
    • 34042
    • 33293
    • 27523
    • 26493
    • 23013
    • 20038
    • 16555
    • 13697
0
10000
20000
30000
40000
Average IOPS, Higher Is Better
  • Average IOPS

Iometer

Workstation workload (80 percent reads)

  • Samsung SSD 850 Pro 256GB
  • OCZ Vector 150 240GB
  • Toshiba HG6 SSD 512GB
  • OCZ Arc 100 240GB
  • Crucial MX100 512GB
  • Crucial M550 512GB
  • SanDisk Extreme PRO 480GB
  • SanDisk Extreme II 480GB
  • Samsung SSD 840 Pro 256GB
  • Intel SSD 730 240GB
  • Samsung SSD 840 Evo 500GB
  • Samsung SSD 840 Evo 250GB
  • SanDisk Ultra Plus 256GB
    • 58158
    • 55856
    • 53541
    • 52296
    • 49391
    • 49203
    • 47093
    • 38028
    • 37165
    • 35744
    • 26369
    • 20769
    • 18912
0
10000
20000
30000
40000
50000
60000
Average IOPS, Higher Is Better
  • Average IOPS

Iometer

Web Server workload (100 percent reads)

  • Samsung SSD 840 Evo 500GB
  • Samsung SSD 850 Pro 256GB
  • Samsung SSD 840 Evo 250GB
  • Samsung SSD 840 Pro 256GB
  • Crucial M550 512GB
  • Crucial MX100 512GB
  • OCZ Vector 150 240GB
  • SanDisk Extreme PRO 480GB
  • OCZ Arc 100 240GB
  • Toshiba HG6 SSD 512GB
  • SanDisk Extreme II 480GB
  • Intel SSD 730 240GB
  • SanDisk Ultra Plus 256GB
    • 32188
    • 32157
    • 32155
    • 32113
    • 32037
    • 31772
    • 31542
    • 30921
    • 30781
    • 30676
    • 30493
    • 29957
    • 14969
0
5000
10000
15000
20000
25000
30000
35000
Average IOPS, Higher Is Better
  • IOPS

I/O Consistency

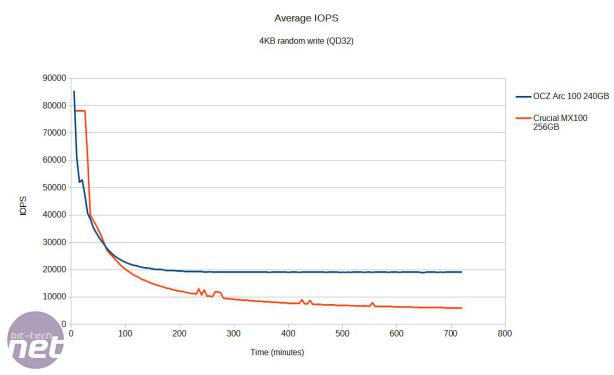
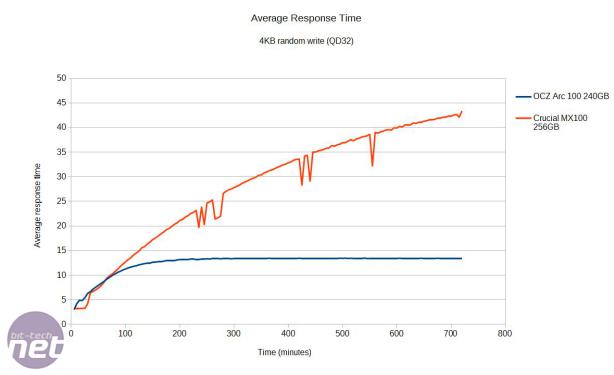
Beginning with this review, we'll now be looking at performance consistency for each SSD that we test. Consistency testing is typically a long process, as it requires you to write masses of data in order to obtain meaningful results. As such, we're currently using Iometer to write random 4KB data to the drive for 12 hours at a queue depth of 32, recording the average IOPS and average response time of each SSD at five minute intervals. Every SSD is secure erased beforehand so as to level the playing field and reset drives to as close to factory performance as possible.

Given that the test is so long, we've only had the chance to test one other drive since receiving the Arc 100, specifically the Crucial MX100 512GB. We'll be looking to add more in the future but the way we evaluate consistency may also change in the near future too, as we're still experimenting with different methods. Finally, our graph engine is not suitable for displaying the results, so we've generated charts in a spreadsheet instead and embedded the images below – please click on each one for the larger and clearer versions.

*OCZ Arc 100 240GB Review **NDA 13/08/14 3pm** OCZ Arc 100 240GB Review - Iometer
Click to enlarge

*OCZ Arc 100 240GB Review **NDA 13/08/14 3pm** OCZ Arc 100 240GB Review - Iometer
Click to enlarge

Discuss this in the forums
YouTube logo
MSI MPG Velox 100R Chassis Review

October 14 2021 | 15:04