MSI Z170A XPOWER Gaming Titanium Edition Review
Written by Antony Leather
October 14, 2015 | 12:01
Tags: #best-170-board #best-lga1151-board #best-skylake-board #cheapest-skylake-board #lga1151 #skylake #z170

PCMark 8 Video Editing
Video Editing v2 Part 2 (Creative 3.0 test suite)
This workload uses FFmpeg to apply video enhancement filters to a high bitrate H.264 video and then encode it to a format suitable for distribution. The FFmpeg binary used is custom built by Futuremark using a development version of the source available from the project's code repository. The test applies a deshaking filter to a source video at 3,840 x 2160 (4K UHD) before scaling down and outputting at 1,920 x 1,080 (1080p).
PCMark 8 4K Video Editing
Part 2 test
- Asus Z170i Pro Gaming (4GHz/4.8GHz)
- Asus Maximus VIII Hero (4GHz/4.8GHz)
- Asus Maximus VIII Gene (4GHz/4.8GHz)
- MSI Z170A XPOWER Gaming Titanium Edition (4GHz/4.8GHz)
- Asus Z170-Deluxe (4GHz/4.8GHz)
- Gigabyte Z170X-Gaming 7 (4GHz/4.8GHz)
- MSI Z170A Gaming M5 (4GHz/4.6GHz)
-
-
111
-
98
-
-
-
111
-
98
-
-
-
111
-
98
-
-
-
112
-
97
-
-
-
112
-
98
-
-
-
112
-
99
-
-
-
112
-
101
-
0
25
50
75
100
125
Seconds, lower is better
-
Stock
-
Overclocked
PCMark 8 Photo Editing V2
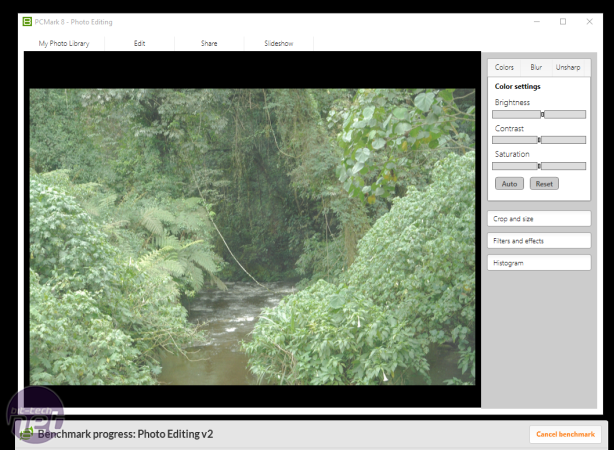
This workload involves making a series of adjustments to a set of photographs using ImageMagik - an open-source image processing library to adjust brightness, contrast, saturation and gamma. When a favourable balance is found, the changes are then applied to the rest of the images in the set. TIFF files up to 67MB in size are used.
PCMark 8 Photo Editing V2
Load image matrix + adjusting times
- Gigabyte Z170X-Gaming 7 (4GHz/4.8GHz)
- Asus Maximus VIII Hero (4GHz/4.8GHz)
- MSI Z170A XPOWER Gaming Titanium Edition (4GHz/4.8GHz)
- Asus Z170i Pro Gaming (4GHz/4.8GHz)
- Asus Maximus VIII Gene (4GHz/4.8GHz)
- Asus Z170-Deluxe (4GHz/4.8GHz)
- MSI Z170A Gaming M5 (4GHz/4.6GHz)
-
-
30
-
28
-
-
-
31
-
27
-
-
-
31
-
28
-
-
-
31
-
29
-
-
-
31
-
29
-
-
-
31
-
30
-
-
-
32
-
30
-
0
5
10
15
20
25
30
35
Seconds, lower is better
-
Stock
-
Overclocked

SATA and M.2 Performance
Website: CrystalDiskMarkWe test the SATA and performance with a Samsung SSD 850 PRO, as this is one of the fastest SSDs we've ever tested, and it can saturate the bandwidth of SATA 6Gbps ports.
For the M.2 port, we use a Kingston KyperX Predator SSD. This is rated at 1,400MB/sec read - not quite saturating the M.2 interface but we've been unable to get our mitts on anything faster for long term testing as the interface is still in its infancy.
SATA 6Gbps and M.2 Performance
CrystalDiskMark
- Asus Z170-Deluxe (Intel M.2)
- MSI Z170A Gaming M5 (Intel M.2)
- Asus Maximus VIII Hero (Intel M.2)
- Gigabyte Z170X-Gaming 7 ((Intel M.2)
- Asus Z170i Pro Gaming (Intel M.2)
- MSI Z170A XPOWER Gaming Titanium Edition (Intel M.2)
- Asus Maximus VIII Gene (Intel M.2)
- MSI Z170A Gaming M5 (Intel SATA 6Gbps)
- Gigabyte Z170X-Gaming 7 (Intel SATA 6Gbps)
- Asus Maximus VIII Hero (Intel SATA 6Gbps)
- Asus Z170i Pro Gaming (Intel SATA 6Gbps)
- Asus Maximus VIII Gene (Intel SATA 6Gbps)
- MSI Z170A XPOWER Gaming Titanium Edition ( (Intel SATA 6Gbps)
- Asus Z170-Deluxe (Intel SATA 6Gbps)
- Asus Z170-Deluxe (ASMedia 6Gbps)
- MSI Z170A XPOWER Gaming Titanium Edition (ASMedia 6Gbps)
- Gigabyte Z170X-Gaming 7 (ASMedia 6Gbps)
-
-
1370
-
664
-
-
-
1368
-
664
-
-
-
1360
-
664
-
-
-
1349
-
660
-
-
-
1328
-
660
-
-
-
1320
-
665
-
-
-
1277
-
662
-
-
-
527
-
499
-
-
-
526
-
495
-
-
-
526
-
492
-
-
-
526
-
490
-
-
-
522
-
495
-
-
-
522
-
479
-
-
-
521
-
493
-
-
-
384
-
397
-
-
-
378
-
395
-
-
-
375
-
394
-
0
250
500
750
1000
1250
1500
MB/sec, higher is better
-
Read
-
Write


Want to comment? Please log in.